Veja como o Actiz LIMS pode transformar seu laboratório
Peça uma demo
How to Implement a KPI Dashboard in Your Lab
Learn step by step how to implement a KPI dashboard in your laboratory and all the benefits it brings.


Learn step by step how to implement a KPI dashboard in your laboratory and all the benefits it brings.
When we hear the term “KPI dashboard,” many people picture a car’s instrument panel in front of the driver, showing the status of different components: transmission, cooling system, fuel, engine, and so on.
But what few people know is that laboratories can also have a KPI dashboard.
Dashboards in a laboratory are generated by a LIMS, and they provide valuable information to help manage laboratory operations.
In addition, the dashboard also makes it possible to visualize the data generated by the laboratory, much like a car’s instrument panel gives the driver the status of the vehicle being driven.
Setting up this kind of dashboard isn’t always an easy task. However, with the help of a LIMS, your laboratory can have several dashboards showing the most relevant aspects of your processes.
So, in this article we’ll talk about what a KPI dashboard is and show some examples of dashboards a LIMS can generate for your laboratory.
What Is a KPI Dashboard?
Also known simply as a dashboard, a KPI dashboard is a visual tool that brings together the information your laboratory wants to monitor. With this dashboard, it’s possible to monitor laboratory performance in the areas that matter most to management and to drive improvements.
With built-in indicators and charts, the dashboard makes it much easier to visualize processes within the laboratory, while also enabling objective tracking against targets, optimizing the time spent managing the work environment.
Some Everyday Benefits for the Laboratory
There are several advantages to using dashboards on a daily basis. For example, on a typical day in a laboratory, an analyst might report that some samples were not correctly registered in the LIMS. The LIMS administrator would then need to check multiple locations within the system to try to figure out what happened.
If a dashboard has been implemented showing the status of samples in the system, the LIMS administrator will easily know that one of the predetermined steps was not completed as it should have been.
In another example, a lab analyst can easily follow a workflow shown on a dashboard and know that they are carrying out their tasks in line with the laboratory’s processes.
Dashboards are advantageous on many occasions. For example, LIMS users can view their daily (or weekly) workload on the dashboard at the start of their shift and review their status from the end of the previous day, while lab managers can quickly get real data without having to generate paper reports.
Here are some examples of KPI dashboards in a LIMS:
Results Tracking
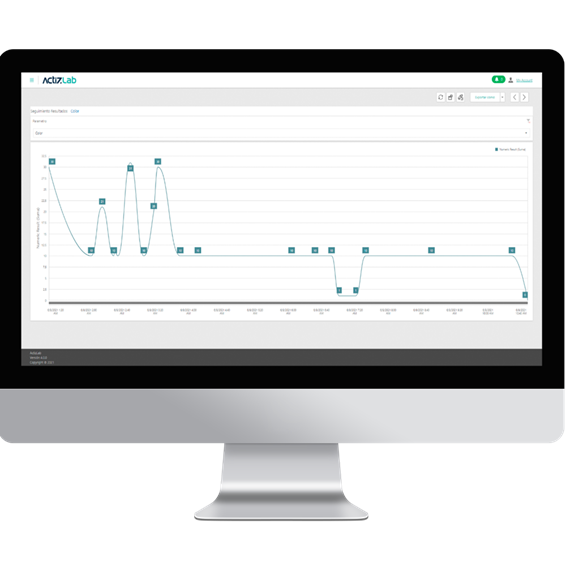
One example of a dashboard frequently seen in LIMS use is the results tracking dashboard. On it, users can track in real time all the results being processed and validated by the laboratory.
Overview of the Laboratory Instrument Maintenance Plan
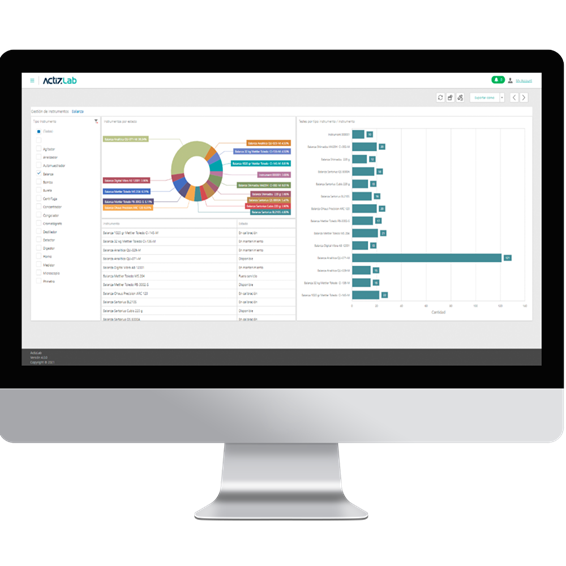
From this dashboard it is possible to view all the laboratory’s instruments in a single indicator, capable of identifying, among other information, which ones are being used most frequently by the laboratory, which instruments are under maintenance or out of service, and which have scheduled maintenance coming up.
Sample Statistics
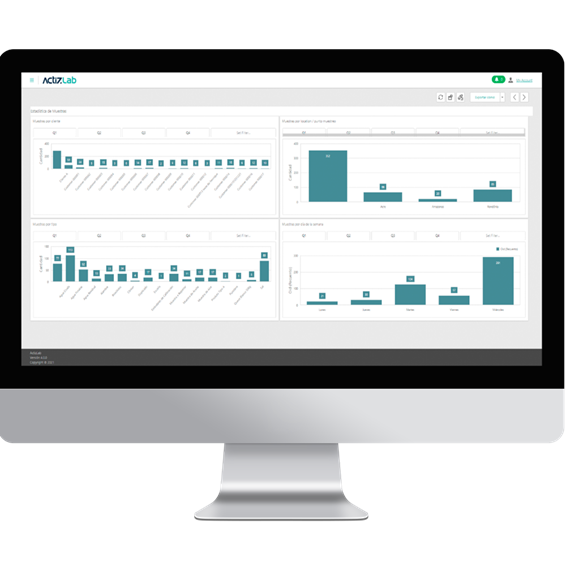
An important control point for laboratory coordination is knowing how often requests are sent to the laboratory, who the biggest clients are (internal or external), which day of the week sees the most requests sent to the laboratory, and which sample matrices are most in demand.
This way, it’s possible to prepare for and adapt workflows to meet these demands in the best way possible.
Sample Turnaround Time
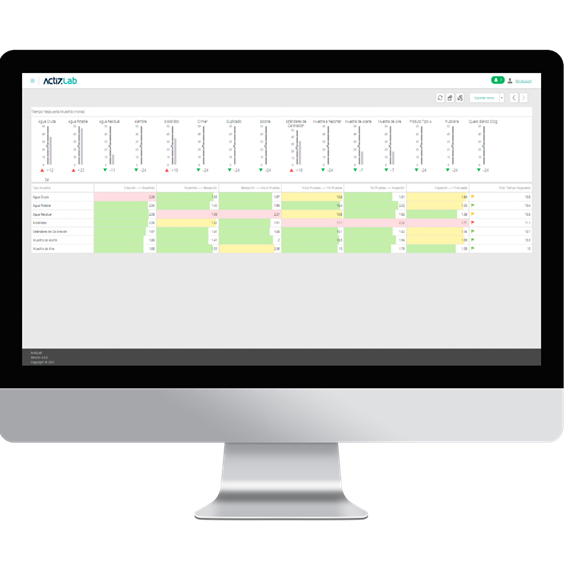
Sample turnaround time is the time interval between samples being received at the laboratory and the moment the final reports are sent out.
Timely notification is a crucial indicator of service quality, together with accurate and reliable reports. With this indicator, the laboratory can easily identify at which stages of the workflow samples are taking longer to process and act on the solution, avoiding late delivery of results.
Conclusion
Implementing the use of KPI dashboards is a great choice for anyone who wants to make it easier to track processes and workflows within the laboratory. And, with the use of a LIMS, this task becomes even easier.
With the implementation of Actiz, an organization can feel more at ease knowing that dashboards have been implemented in the ideal way and will provide maximum efficiency and safety to the laboratory.
If you’re interested and want a LIMS that guarantees process optimization and increased efficiency in your laboratory, get in touch and get Actiz.